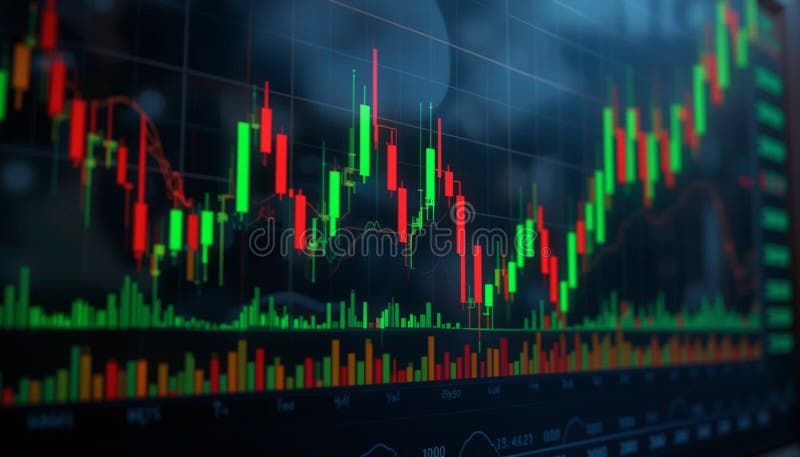
Real time forex and cryptocurrency trading data with technical indicators market trends stock chart candlestick graph financial 向量例证 real time forex and cryptocurrency trading data with technical indicators market trends stock chart candlestick graph financial
A red toned financial market chart symbolizes a recession bear market or stock market crash highlighting volatility and 向量例证 a red toned financial market chart symbolizes a recession bear market or stock market crash highlighting volatility and
Market volatility red stock chart depicting financial downturn or economic recession on monitor generated by ai 皇族释放例证 market volatility red stock chart depicting financial downturn or economic recession on monitor generated by ai
A detailed candlestick chart displays stock market fluctuations and financial analysis indicators it visualizes trading patterns 向量例证 a detailed candlestick chart displays stock market fluctuations and financial analysis indicators it visualizes trading patterns
Flat illustration of technical analysis with a magnifying glass on yellow background stock market correction concept bankrupt 向量例证 flat illustration of technical analysis with a magnifying glass on yellow background stock market correction concept bankrupt